


Once we have a sample of reservoir fluid, either directly or by recombination, we need to do reservoir fluid measurement, often called PVT analysis. There are mainly 6 fluid properties measured: oil density, gas density, solution GOR, bubble point pressure, formation volume factor, and viscosity. This post will discuss how the bubble point pressure is measured and what the Constant Composition Expansion Experiment is?
Experimental apparatus:
The bubble point pressure is determined by an experiment called Constant Composition Expansion (CCE). It’s also called Constant Mass Expansion (CME) experiment or Pressure-Volume (PV) relationship.
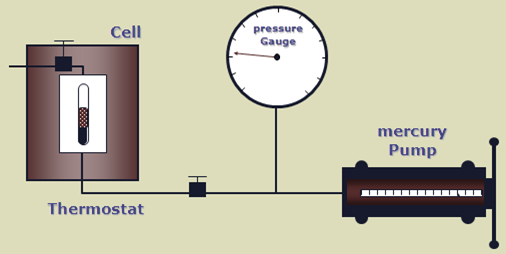
The apparatus used to perform this experiment is the PV cell, as shown in the figure below. The fluid is charged in the PV cell after recombining the oil and gas in the correct proportions. The temperature, controlled by a thermostat, is maintained constant throughout the experiment (the measured reservoir temperature). The cell pressure is controlled by a positive displacement pump and recorded on an accurate pressure gauge.
Bubble Point Pressure:
The bubble point pressure is the pressure, at some reference temperature, that the first bubble of gas is liberated from the liquid phase. It is also known as the saturation pressure.
The reference temperature is usually the reservoir temperature, but any temperature can be used.
Note that the bubble point pressure is a function of temperature and changing the reference temperature will change the bubble point pressure.
Bubble Point Measurement:
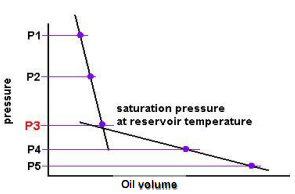
A schematic of a Constant Composition Expansion experiment steps is shown in the figure below. The PV cell pressure is initially raised to a value greater than the bubble point pressure. the pressure is subsequently reduced in stages, and on each stage, the volume of the cell is recorded.
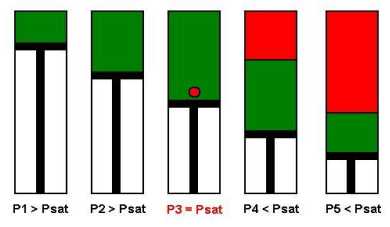
Initially, the oil volume change is small (points: P1 and P2) until we reach some point (P3) where we get a large volume change (P4 and P5). P3 is the bubble point pressure at which the gas begins to come out of the solution and form bubbles and the overall compressibility of the system increases significantly. In this manner, the CCE experiment can be used to measure the bubble point pressure.
Example:
The following table illustrates the results of a CCE experiment for an oil sample obtained by subsurface sampling. The temperature is maintained constant and equal to 114 °C. The bubble point pressure for this sample is equal to 424.5 bar. The relative volume in the graph below are volumes measured in relation to this bubble point volume (@Pb, Vrel = 1).
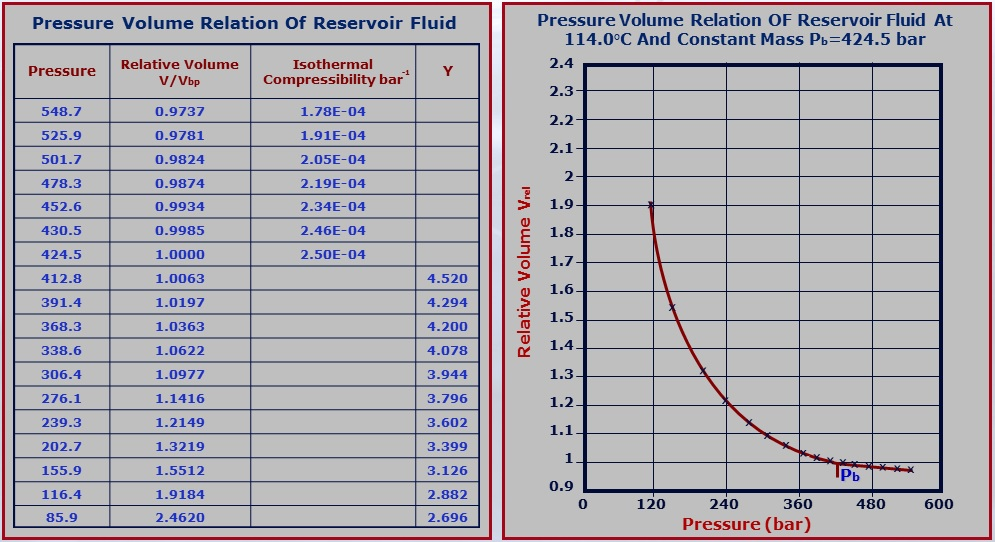
NB: The shape of the (Relative Volume)-Pressure curve changes with the type of the reservoir fluid (either black oil, volatile oil, gas condensate, dry gas).
You May Also Like…
- PVT Sampling Methods: Downhole, Wellhead & Surface Recombination
- PVT Experiment: Differential Liberation
- PVT Experiment: Separator Test
- PVT Properties and Correlations

