


How To Easily Read A Well Log in 5 Minutes Using ‘Six Ko Ko Rules’
By Dosh Nazlan, Petrophysicist.
Petrophysicists look at the well log patterns, recognize the trends, and then turn those patterns into reservoir knowledge.
Well logs can tell us many stories about our reservoir. Each colorful line, each curve deflection and each curve type create the story of our reservoir.
Each reservoir story is different from one another.
But for sure, every story begins the same way. The story starts when the oil and gas, trapped inside the reservoir for million of years, get very excited to come out.
Our main task is to figure out the right story by using well logs and other lab data to make the storyline better.
When we run well logs, these hydrocarbon pools tell us everything – where they are, how they look like and how much they are, so we know how to get them.
But before we understand any story, we need to be able to read these well logs.
My first mentor, Ko Ko Kyi, first taught me how to read and interpret well logs just by looking at the well log patterns. I want to share the same tips with you today.
It’s just a common sense, step-by-step approach in interpreting any well logs. But the results are magical.This is a technique I called ‘The Ko Ko Rules’.
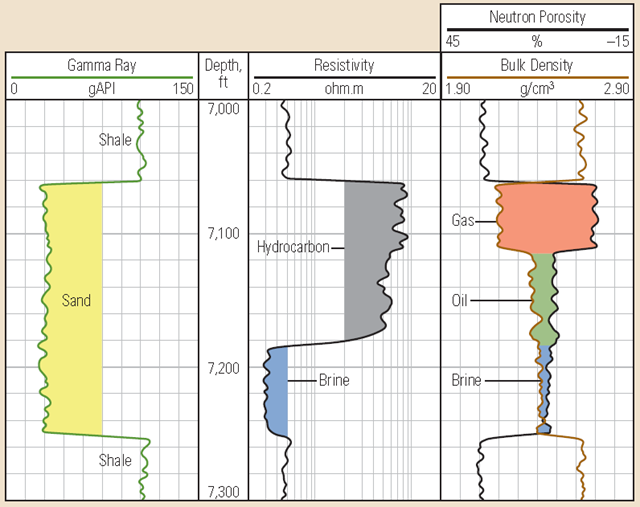
To make it work, you need to have Gamma Ray Log, Resistivity Logs, Density and Neutron logs plotted on the same log plot respectively. Then, by looking at how the curve deflects relative to each other, you can tell the difference between oil, gas and water. Isn’t that neat?
But first, you need to understand the reasons we run any well logs.
When you run a well log, you are interested in:
- locating where you reservoir is,
- describing your reservoir, and
- knowing if you have oil or gas in your reservoir.
The rules work and they make sense. The rules could look too simple, but the results could be profound to your work. As long as you could read a graph and could tell the difference between right and left, or blue and red, then you can use these rules.
Some people call it monkey rules because they think it’s stupidly simple for an engineer. But I don’t care as long as it works for me and helps me do my job well, I am happy. Hopefully, you’ll find it useful too.
But, like any other rules, there’s always exception. It’s like when you tell your daughter not to play with the ipad all the time, but you spend too much time on your smartphone! Ouch! You can’t blindly apply this rules all the time. It won’t work in unconventional reservoirs or in a low resistivity pay. But it’s worth a try.
Here we go:
What you need:
1. Plot triple combo logs in this sequence GR, Resistivity, Density-Neutron. Plot GR in the first track and Resistivity in the second track. Both curves should be plotted in increasing values from the left to the right. Plot Density-Neutron together on the same track. The values should be decreasing as we go from the left to the right.

The First Curve
To look for a reservoir, you need a Gamma Ray log. Normally, your reservoir will give low Gamma Ray reading. High Gamma Ray reading most probably indicates shale zones or non reservoir rocks.
The Second Curve
Second, once you have located your reservoir, then you want to see how good your reservoir is. This is generally done by means of calculating porosity. A good reservoir typically has good overall effective porosity. To be able to gauge whether you target reservoir is porous, you need logging tools that can give you indication of porosity. The most typical porosity tools are density, neutron and sonic. Sometimes, people do go fancy. So they go for Nuclear Magnetic Resonance (NMR) log and others.
The Third Curve
Third, since you know where and how good your reservoir is, now you must know whether your reservoir contains oil, gas or water. For this purpose, you need resistivity log. In most cases, if you have a hydrocarbon bearing zone, your resistivity reading will be higher than the resistivity reading in water bearing zone (assuming your water is saline). You have to be careful though because if your formation water is fresh, your resistivity reading will be high too. In this case, you need additional information like getting a formation sample or running a fluid typing log to make sure the types of fluid you have.
2. Plot Density-Neutron in lithology compatible scale: Sandstone or Limestone scales. We will be able to tell the reservoir types, the fluid types and estimate porosity right away.

3. Look at the directions of GR, Resistivity, Density and Neutron curves deflections, either to the right or to the left.
4. By combinating the patterns of each curve deflections, we can tell the difference between reservoir and non reservoir and/or the fluid types (oil vs gas vs water).
Follow the Ko Ko Rules:
1. Look at the directions of the curve deflections (whether to the right or to the left) in these following sequence: GR-Res-Density-Neutron.
1. Tight non-reservoir: Right-Right-Right-Right.
GR-Res-Density-Neutron all deflect to the right.
Why it works: If we are not in a reservoir zone, GR is higher due to larger natural radioactivity from U, Th, K contents. Resistivity is higher due to tightness. Density and Neutron read low porosity.

2. Shale: Right-Right-Right-Left.
GR, Res-Den deflect to the right. Only Neutron deflects to the left.
Why it works: GR is higher due to larger natural radioactivity from U, Th, K contents. Resistivity is higher due to tightness. Density read low porosity. Neutron falsely responds to the clay bound water resulting to higher apparent porosity. You will see a reversed Density-Neutron crossover.
Sometimes, the resistivity could deflect to the left as well, depending on the properties of the shale itself. So it could read, Right-Left-Right-Left.
Note: You might see a reversed Density-Neutron crossover in dolomite. Over a dolomitic zone, GR reads lower.

3. Low porosity (tight) reservoir: Left-Right-Right-Right.
GR deflects to the left, GR-Res-Density-Neutron deflect to the right.
Why it works: GR reads lower due to lower radioactivity of Th, K and U. Resistivity, Density-Neutron respond to the tightness of the reservoir (rock quality), rather than to the fluid types.

4. Water bearing reservoir: Left-Left-Left-Left.
GR-Res-Density-Neutron all deflect to the left.
Why it works: GR reads lower due to lower radioactivity of Th, K and U. Resistivity responds to saline formation water. Density-Neutron reads higher porosity in reservoir.

5. Oil bearing reservoir: Left-Right-Left-Left.
GR and Density-Neutron all deflect to the left. Only resistivity deflects to the right.
Why it works: GR reads lower due to lower radioactivity of Th, K and U. Resistivity responds to non conducive hydrocarbon, giving higher resistivity. Density-Neutron reads higher porosity in reservoir.

6. Gas reservoir: Left-Right-Left-Right.
GR deflects to the left; Resistivity, right; Density left; and Neutron, right.
Why it works: GR reads lower due to lower radioactivity of Th, K and U. Resistivity responds to non conducive hydrocarbon, giving higher resistivity. Density gives lower bulk density due to lower gas density. Neutron reads low apparent low porosity in gas zone due to lower neutron-hydrogen interactions in gas as compared to neutron-hydrogen interactions in water.

So, there you go – the six Ko Ko Rules in well log interpretation. With these rules, you are able to read any logs in no time, and figure out your own reservoir stories!
As always, I don’t guarantee it to work all the time. It may not work for freshwater environment, low resistivity pay zones, hot sands, and perhaps in some unconventional reservoirs.
Thanks Ko Ko, you rule!
Source: http://superpetrophysics.com
