


ESP Diagnostic Diagram
By Burney Waring, Consultant at WaringWorld, Inc.
One of my clients brought this diagram to my attention recently. The paper, by Petroleum Development Oman and Engineering Insight Ltd of Aberdeen, was very useful and included an especially useful diagram, but the diagram was not so easy to read or print in a larger size. I tried to improve the image so that it would be even more helpful. All credit goes to the authors and their paper IPTC 17413 2014, available on SPE’s OnePetro.
Here is the full size diagram:
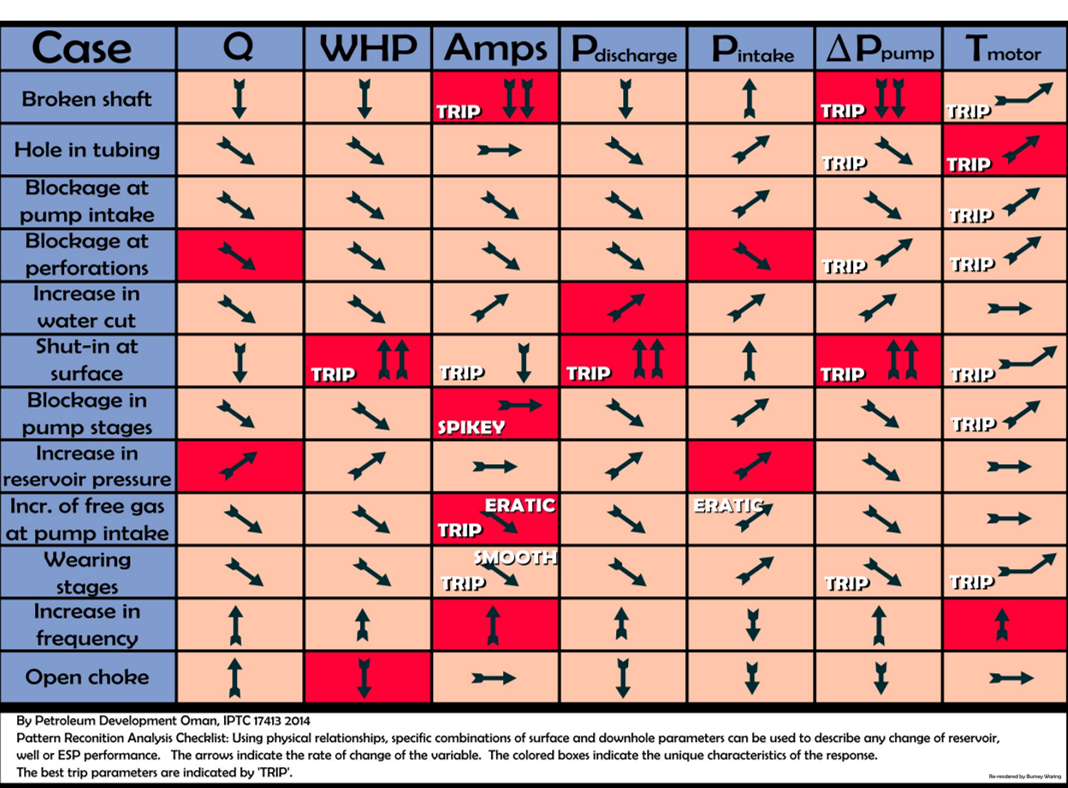
To use the diagram, consider that something such as a blockage of in pump intake and increase in free gas might only differ slightly, such as in terms of motor temperature and possibly the behavior of the ammeter. Focus on these areas in troubleshooting may help diagnose the problem.
Reference:

gooj
This diagram is super cool. The idea is mature enough to put it in a neural network where the inputs could be flow rate, wellhead pressure, current, discharge pressure, intake pressure, delta-P and temperature at the motor (as per columns in the diagram). The output of the neural network is the diagnosis (rows on the left, probably, I would add few more), and the transition zone will the preventive maintenance area (likely to occur).
Thanks for sharing!
Thanks for sharing this “almighty” chart for ESP diagnosis. At best it can be a first-pass for my ESP analysis. Presently establishing the relationship between variables, thereafter, I intend to code these relationships.