


The pump performance curves characterize the performance of ESP pumps. This article will detail the technical aspects related to these curves and will answers the following questions: How pump performance curve is obtained? How to plot it? What are the downthrust and the upthrust? What is the recommended operating range of the pump?
Pump Curve:
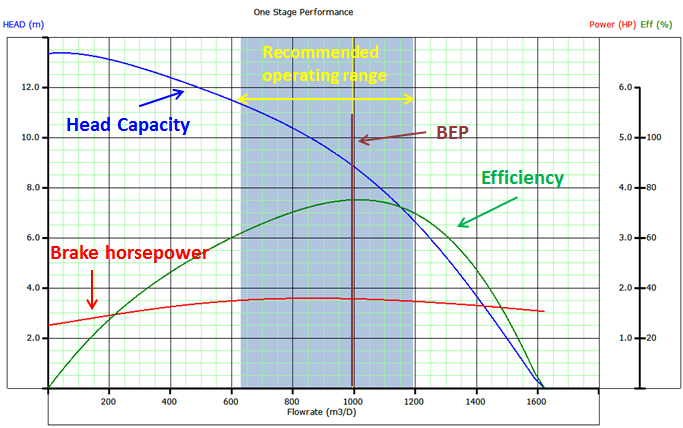
The published pump performance curve describes the performance of particular pump (or stage). It shows the discharge head developed by the pump, brake horsepower (power consumption curve), and efficiency of the pump as a function of flow rate. It is an experimental curve given by the manufacturer and obtained with freshwater at 60 °F (S.G. = 1) under controlled conditions detailed in API RP11 S2. These curves are commonly available for both 50 Hz and 60 Hz operation and must represent the operation of one or more stages of each pump curve (the number of pump stages must be clearly indicated on the pump chart).
Typical Pump Curve
- The left vertical axis is scaled in feet and meters of head (or lift).
- The bottom horizontal axis is scaled in bbl/d and m3/d.
- The curve labeled Head-Capacity defines the lift (or head) the impeller can produce at all of the available flow rates.
- The first vertical axis on the right is scaled in horsepower. It is based on pumping water with a specific gravity of 1.00.