Hydrocarbon Phase Behavior

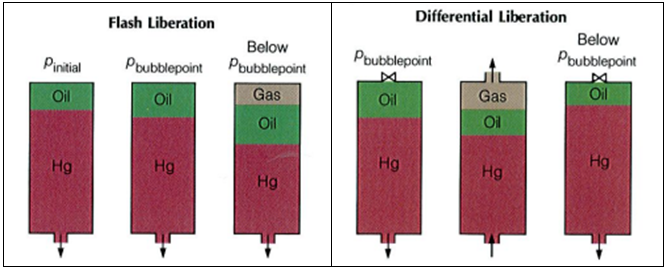
To understand the complex behavior of a reservoir fluid ” Hydrocarbon Phase Behavior “, let’s, first of all, consider the simple case of a single-compound hydrocarbon, ethane for example, initially in gas form in a cell containing mercury. As mercury is gradually injected, the gas is subjected to a continuously increasing pressure. The temperature is held constant. Actually, isothermal conditions simulate a reservoir’s generally constant temperature. At some unique pressure – the vapour pressure – the gas will condensate into a liquid.

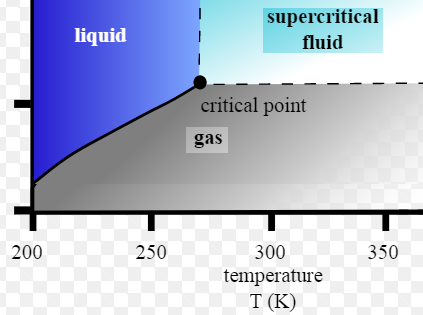
Vapour Pressure line: is the line defining the pressures at which the transition from gas to liquid occurs. Above this line, the single-compound hydrocarbon exists as a liquid, below as gas.

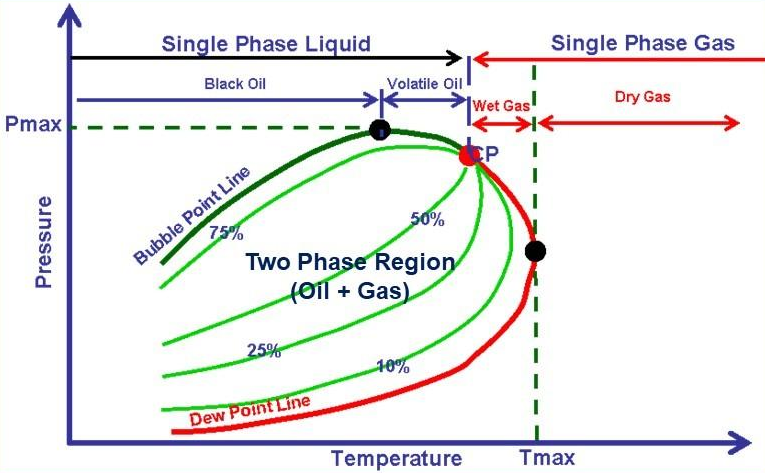
Critical Point: is the point at which it is no longer possible to distinguish whether the fluid is liquid or gas. The intensive properties of both phases are identical.

Naturally occurring hydrocarbons are more complex than the system shown above. They contain much more members of paraffin series and usually some non-hydrocarbon impurities. Nevertheless, a phase diagram can similarly be defined for complex mixtures. A typical diagram for a natural gas is shown in the following graph:

Continue reading

PVT Sampling Methods: Downhole, Wellhead & Surface Recombination

Samples of the reservoir fluid are usually collected at an early stage in the well’s producing life and dispatched to a laboratory for the f PVT analysis. The objectives of sampling are to receive samples from a suitable place in the production wells or surface facilities. The samples should represent the system in the reservoir under its initial conditions in order to determine its type, volumetric and phase behavior, and its composition. PVT analysis results are needed for geological and reservoir engineering evaluation and forecasting, as well as for laboratory studies concerning enhanced oil recovery (EOR).

There are basically three ways of collecting fluids samples from a well, either by Downhole SamplingWellhead Sampling or by  Surface Recombination Sampling.

Continue reading

PVT Experiments: Separator Test

Separator Test experiments are carried out for both oil and gas condensate mixtures. A sample of reservoir liquid is placed in the laboratory cell and brought to reservoir temperature and bubble-point pressure. Then the liquid is expelled from the cell through a number of stages of separation.  Usually, two or three stages of separation are used, with the last stage at atmospheric pressure and near-ambient temperature (60 to 80°F).

The gas is let out of the separator through the top and is transferred to standard conditions, where its volume is measured. As for the differential liberation experiment, liquid dropping out from the gas is converted to an equivalent gas volume at standard conditions.

The liquid from the first separator is let into a second separator at a lower pressure and temperature than the first one. At which conditions, more gas will be liberated as sketched in the figure below. As with the gas from the first separator, this gas is transferred to standard conditions.

The oil remaining after gas removal is brought to the conditions of the next separator stage. The gas is removed again and quantified by moles and specific gravity. Oil volume is noted, and the process is repeated until stock-tank conditions are reached. Final oil volume, Vo, and specific gravity, SGo, are measured at 60°F.

Continue reading

PVT Experiments: Differential Liberation

The bubble point pressure is determined by an experiment called “Constant Composition Expansion” (CCE), also called: “flash liberation”. The device used to perform this experiment is the PV cell, as shown and described in the article “Constant Composition Expansion “. The Differential Liberation (DL), discussed in this article, is experimentally performed in a similar PV cell.

The main difference between these two types of experiments is that in the Constant Composition Expansion (or flash expansion) no gas is removed from the PV cell. But instead, the gas remains in equilibrium with the oil. As a result, the overall hydrocarbon composition in the cell remains unchanged.

In the differential liberation experiment, however, pressure gradually decreases in steps and any liberated gas is removed from the oil. All depletion stages are performed at the same reservoir temperature. Therefore, there is a continual compositional change in the PV cell, the remaining hydrocarbons becoming progressively richer in the heavier components, and the average molecular weight thus increasing.

The differential liberation experiment starts at the bubble point pressure determined from the CCE (since above this pressure the flash and differential experiments are identical).

Example*:

The following example guides you on how to use and interpret the data from Differential Liberation test. The reservoir temperature is T= 200 °F and the bubble point pressure is 3330 psia.

The essential data obtained from the differential liberation experiment, performed on the same oil sample as CCE test, are listed in the following table:

Continue reading

PVT Properties and Correlations

Ideally, laboratory measured PVT data should be utilized. Many times, laboratory data is not available and correlations must be used instead. This post will discuss PVT properties and correlations that can be used to estimate them. It is difficult to say which correlation should be used when. This is because most of the correlations were developed with regional crude samples. The best correlation is the one that matches your data.

Many investigators have used PVT laboratory test results, and field data, to develop generalized correlations for estimating properties of reservoir fluids. The main properties which are determined from empirical correlations are the bubble point, gas solubility, volume, density, compressibility, and viscosity. The correlations typically match the employed experimental data with an average deviation of less than a few percent. It is not unusual, however, to observe deviations with an order of magnitude higher when applied to other fluids.

  1. Bubble Point Pressure (Pb):

The bubble point pressure, also known as the saturation pressure, is the pressure, at some reference temperature, that the first bubble of gas is liberated from the liquid phase. The reference temperature is usually the reservoir temperature, but any temperature can be used. Note that the bubble point pressure is a function of temperature and changing the reference temperature will change the bubble point pressure.

Statistical analysis of correlations:

Al-Shammasi, in his SPE paper “A Review of Bubble point Pressure and Oil Formation Volume Factor Correlations” (SPE-71302-PA, April 2001), compiled a databank of 1,243 data points from the literature. This was supplemented by 133 samples available from a GeoMark Research database (GeoMark Research. 2003. RFD base (Reservoir Fluid Database)), bringing the total number of data points to 1,376. These data were then used to rank the bubble point pressure correlations. The following Table summarizes the ranges of data used for bubble point pressure, temperature, oil FVF, Solution GOR, oil gravity, and gas specific gravity.

Continue reading