PVT Experiments: Differential Liberation

The bubble point pressure is determined by an experiment called “Constant Composition Expansion” (CCE), also called: “flash liberation”. The device used to perform this experiment is the PV cell, as shown and described in the article “Constant Composition Expansion “. The Differential Liberation (DL), discussed in this article, is experimentally performed in a similar PV cell.

The main difference between these two types of experiments is that in the Constant Composition Expansion (or flash expansion) no gas is removed from the PV cell. But instead, the gas remains in equilibrium with the oil. As a result, the overall hydrocarbon composition in the cell remains unchanged.

In the differential liberation experiment, however, pressure gradually decreases in steps and any liberated gas is removed from the oil. All depletion stages are performed at the same reservoir temperature. Therefore, there is a continual compositional change in the PV cell, the remaining hydrocarbons becoming progressively richer in the heavier components, and the average molecular weight thus increasing.

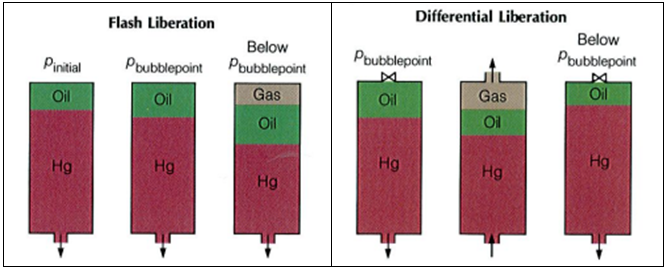
The differential liberation experiment starts at the bubble point pressure determined from the CCE (since above this pressure the flash and differential experiments are identical).

Example*:

The following example guides you on how to use and interpret the data from Differential Liberation test. The reservoir temperature is T= 200 °F and the bubble point pressure is 3330 psia.

The essential data obtained from the differential liberation experiment, performed on the same oil sample as CCE test, are listed in the following table:

Continue reading

Effect of CO2 on downhole flowrate calculation

Downhole flow rate can be calculated from surface flow rate (stock tank barrels) using the following equation. It is assumed that no gas is dissolved in the water phase and the water formation volume factor is equal to one.

Downhole flow rate = [(Oil rate)sc × Bo] + [(Free GOR) × (Oil rate)sc × Gas FVF] + (Water rate)sc

Free GOR = Producing GOR – Solution GOR, therefore:

q = ( Qo × Bo ) + [ ( R – Rs) × Qo × Bg × 1000] + Qw

Where:

  • q = downhole flow rate (bbl/d or m3/d)
  • Qo = Oil flow rate at standard conditions (stb/d or m3sc/d)
  • Bo = Oil formation volume factor (bbl/stb or m3sc/m3sc)
  • R = Producing gas-oil ratio (scf/stb or m3sc/m3sc)
  • Rs = Solution gas-oil ration (scf/stb or m3sc/m3sc)
  • Bg = Gas formation vol. factor (bbl/mscf or m3sc/m3sc)
  • Qw = Water flow rate at standard conditions (stb/d or m3sc/d)

Effect of CO2 on downhole flowrate calculation:

If CO2 is present, the calculation of downhole flow rate becomes more complex for many reasons:

Continue reading

PVT Properties and Correlations

Ideally, laboratory measured PVT data should be utilized. Many times, laboratory data is not available and correlations must be used instead. This post will discuss PVT properties and correlations that can be used to estimate them. It is difficult to say which correlation should be used when. This is because most of the correlations were developed with regional crude samples. The best correlation is the one that matches your data.

Many investigators have used PVT laboratory test results, and field data, to develop generalized correlations for estimating properties of reservoir fluids. The main properties which are determined from empirical correlations are the bubble point, gas solubility, volume, density, compressibility, and viscosity. The correlations typically match the employed experimental data with an average deviation of less than a few percent. It is not unusual, however, to observe deviations with an order of magnitude higher when applied to other fluids.

  1. Bubble Point Pressure (Pb):

The bubble point pressure, also known as the saturation pressure, is the pressure, at some reference temperature, that the first bubble of gas is liberated from the liquid phase. The reference temperature is usually the reservoir temperature, but any temperature can be used. Note that the bubble point pressure is a function of temperature and changing the reference temperature will change the bubble point pressure.

Statistical analysis of correlations:

Al-Shammasi, in his SPE paper “A Review of Bubble point Pressure and Oil Formation Volume Factor Correlations” (SPE-71302-PA, April 2001), compiled a databank of 1,243 data points from the literature. This was supplemented by 133 samples available from a GeoMark Research database (GeoMark Research. 2003. RFD base (Reservoir Fluid Database)), bringing the total number of data points to 1,376. These data were then used to rank the bubble point pressure correlations. The following Table summarizes the ranges of data used for bubble point pressure, temperature, oil FVF, Solution GOR, oil gravity, and gas specific gravity.

Continue reading