


Ideally, laboratory measured PVT data should be utilized. Many times, laboratory data is not available and correlations must be used instead. This post will discuss PVT properties and correlations that can be used to estimate them. It is difficult to say which correlation should be used when. This is because most of the correlations were developed with regional crude samples. The best correlation is the one that matches your data.

Many investigators have used PVT laboratory test results, and field data, to develop generalized correlations for estimating properties of reservoir fluids. The main properties which are determined from empirical correlations are the bubble point, gas solubility, volume, density, compressibility, and viscosity. The correlations typically match the employed experimental data with an average deviation of less than a few percent. It is not unusual, however, to observe deviations with an order of magnitude higher when applied to other fluids.
- Bubble Point Pressure (Pb):
The bubble point pressure, also known as the saturation pressure, is the pressure, at some reference temperature, that the first bubble of gas is liberated from the liquid phase. The reference temperature is usually the reservoir temperature, but any temperature can be used. Note that the bubble point pressure is a function of temperature and changing the reference temperature will change the bubble point pressure.
Statistical analysis of correlations:
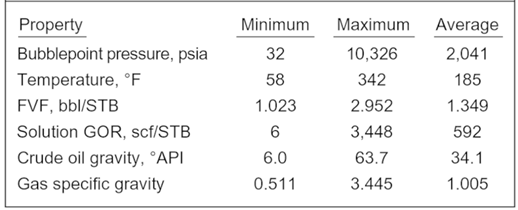
Al-Shammasi, in his SPE paper “A Review of Bubble point Pressure and Oil Formation Volume Factor Correlations” (SPE-71302-PA, April 2001), compiled a databank of 1,243 data points from the literature. This was supplemented by 133 samples available from a GeoMark Research database (GeoMark Research. 2003. RFD base (Reservoir Fluid Database)), bringing the total number of data points to 1,376. These data were then used to rank the bubble point pressure correlations. The following Table summarizes the ranges of data used for bubble point pressure, temperature, oil FVF, Solution GOR, oil gravity, and gas specific gravity.
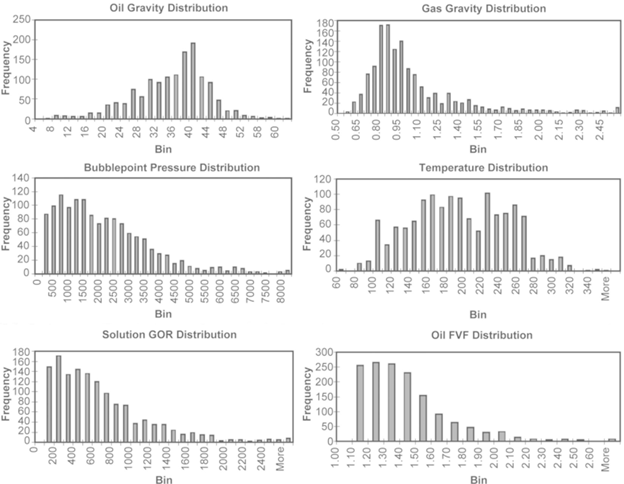
The following graph shows the distribution of data used to prepare PVT correlations.
- Solution Gas-Oil Ratio (Rs):
Consider a volume of oil taken at wellbore pressure and temperature. Now bring this sample to standard temperature and pressure. The solution gas-oil ratio is the ratio of the volume of evolved gas to the remaining volume of oil.
The typical Oilfield unit of solution GOR is standard cubic feet of gas per stock tank barrel of oil (scf/stb). The dimensionless ratio of volume of gas per volume of oil (scfg/scfo or Sm3g/Sm3o) is also used.
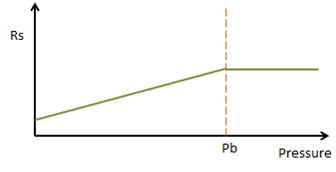
The following graph shows a typical solution gas-oil ratio behavior at constant temperature. As the pressure increases, more and more gas can be forced into the liquid phase. The pressure when the liquid phase cannot hold any more gas is the bubble point pressure.
Bubble point pressure and solution gas-oil ratio are closely linked. Several correlations are available to estimate these values. The same correlation is used to calculate both properties.
Correlations used to estimate Solution GOR and bubble point pressure:
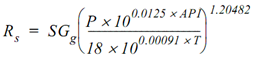
- Standing:
Published in 1947, Standing used a total of 105 data points on 22 different crude oils from California to develop his correlations. Standing is the oldest, simplest and most commonly used correlation.
Standing initially produced a graphical correlation for estimating the solution GOR and bubble point pressure, and later expressed the graph by the following correlation:
Where:
- Rs = Solution gas-oil ratio (scf/stb)
- API = Oil API gravity
- SGg = Gas specific gravity (relative to air)
- P = Pressure (psia)
- T = Temperature (°F)
- Lasater:
Lasater published his correlation in 1958. He used 137 crude samples from Canada, western and mid-continental US and South America.
- Vazquez & Beggs:
Published in 1977, Vazquez and Beggs developed correlations for the solution GOR and formation volume factor using 6004 data points and used 27 North American fluid samples.
- Glaso:
Glaso published his correlation in 1980, he used data from 45 oil samples mostly from the North Sea region to develop his correlations.
- Marhoun:
Marhoun published his correlation in 1988, he used 160 bubble point data on 69 Middle East crude samples to develop a bubble point pressure correlation.
- Ahmed:
Ahmed used the combined reported data of Glaso and Marhoun to develop a correlation for determining the oil formation volume factor.
- Asgarpour et al., Labedi and Petrosky-Farshad:
They used data on fluids from reservoirs in Western Canada, Africa, and Texas-Louisiana respectively to develop various correlations.
- De Ghetto et al.
De Ghetto et al. Used about 3700 measured data points on 195 crude oil samples from the Mediterranean Basin, Africa, Persian Gulf and North Sea to evaluate published correlations, and modified some of them to improve predicted results.
- Kartoatmodjo:
Published in 1990, Kartoatmodjo’s correlation was based upon a literature review of previously published crude analysis results plus additional samples from Alaska, California and Southeast Asia.
- Oil Formation Volume Factor (Bo):
The oil formation volume factor is the ratio of volume occupied in the reservoir by a volume of oil measured at standard conditions. This included the effect of dissolved gas. Units are reservoir barrels per stock tank barrel (bbl/stb) or cubic meters per cubic meter at standard conditions (m3/Sm3).
Note this is a dimensionless quantity and is the same in US oilfield or metric units.
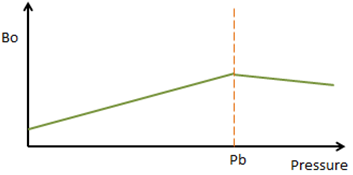
The following graph shows a typical oil formation volume factor behavior at constant temperature. As the pressure increases more and more gas goes into the liquid phase resulting in an increased formation volume factor. Once the bubble point is reached, no more gas can be forced into solution and the formation volume factor begins a gradual decline as the liquid is compressed.
The oil formation volume factor can be used to calculate the volume a barrel of oil at the surface occupies at downhole conditions (including the volume of dissolved gas) using the following equation.
qo = Qo x Bo
Where:
- qo = Oil volumetric flow rate at downhole conditions (bbl/d or m3/d)
- Qo = Oil volumetric flow rate at standard conditions (stb/d or Sm3/d)
- Bo = Oil formation volume factor (bbl/stb or m3/Sm3)
Correlations used to estimate the formation volume factor:
- Standing:
Published in 1947, Standing used a total of 105 data points on 22 different crude oils from California to develop his correlations. Standing is the oldest, simplest and most commonly used correlation.
Standing initially produced a graphical correlation for estimating the oil formation volume factor, and later expressed the graph by the following correlation:
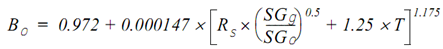
Where:
- Bo = Oil formation volume factor (bbl/stb)
- Rs = Solution gas-oil ratio (scf/stb)
- SGg = Gas Specific Gravity (relative to air)
- SGo = Oil Specific Gravity (relative to water)
- T = Downhole Temperature (°F)
- Gas Formation Volume Factor (Bg):
The gas formation volume factor is the ratio of the volume occupied in the reservoir by a volume of gas measured at standard conditions.
Oilfield units for Bg are typically either reservoir barrels per thousand cubic feet of gas (bbl/Mscf) or reservoir cubic feet (or meters) of gas per standard cubic foot (or meter) of gas (cf/scf or m3/Sm3).
The following Gas Formation Volume Factor (bbl/Mscf) equation can be used to calculate Bg for particular unit systems.
Bg = [5.05 × Z × (T + 460)] / P
Where:
- Bg = Gas formation volume factor (bbl/Mscf)
- Z = Gas Compressibility Factor
- T = Downhole Temperature (°F)
- P = Downhole Pressure (psia)
The equation for calculating Bg is simple enough, but it requires that you know the gas compressibility factor.
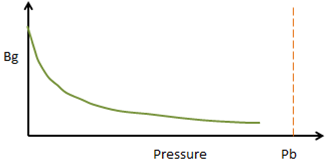
The following graph shows a typical gas formation volume factor behavior at constant temperature. As pressure increases the gas is compressed and Bg becomes smaller.
The gas formation volume factor can be used to calculate the volume a barrel of gas at the surface occupies at downhole conditions using the following equation:
qg = Qg × Bg
Where:
- qg = Gas volumetric flow rate at downhole conditions (scf/d or m3/d)
- Qg = Gas volumetric flow rate at standard conditions (scf/d or Sm3/d)
- Bg = Gas formation volume factor (bbl/scf or m3/Sm3)
Unlike oil and water formation volume factors, the gas formation volume factor does not include the effect of gas dissolved in the oil or water. This means we must subtract the volume of gas dissolved in the oil or water, before applying the gas formation volume factor. The following equation can be used to calculate the free gas volume at downhole conditions:
Qg= (GOR × Qo) – (Rs × Qo) – (Rsw × Qw)
Where:
- Qg = Gas volumetric flow rate at standard conditions (scf/d or Sm3/d)
- Qo = Oil volumetric flow rate at standard conditions (stb/d or Sm3/d)
- Qw = Water volumetric flow rate at standard conditions (stb/d or Sm3/d)
- GOR = Producing gas-oil ratio (scf/stb or Sm3/Sm3)
- Rs = Solution gas-oil ratio (scf/stb or Sm3/Sm3)
- Rsw = Solution gas-water ratio (scf/stb or Sm3/Sm3)
If we assume Rsw = 0, then the free gas volume at downhole conditions is equal to:
Qg = (GOR-Rs) × Qo
Therefore:
(qg)free = [(GOR-Rs) × Qo] × Bg
If the gas volume is reported as a Gas-Liquid Ratio (GLR), we can use the following equation instead to calculate the free gas volume at downhole conditions:
Qg= (GLR × QL) – (Rs × Qo) – (Rsw × Qw)
If we assume Rsw = 0, then the free gas volume at downhole conditions is equal to:
Qg= (GLR × QL) – (Rs × Qo)
Therefore:
(qg)free = [(GLR × QL) – (Rs × Qo)] × Bg
If a negative value is calculated for Qg it means all of the gas is in solution, and no free gas is downhole.
You May Also Like…
- PVT Sampling Methods: Downhole, Wellhead & Surface Recombination
- PVT Experiments: Constant Composition Expansion
- PVT Experiments: Differential Liberation
- PVT Experiments: Separator Test

