In the previous article “Pump Performance Curves – part 01“, we have discussed how pump performance curves are obtained? How there are plotted? What are the downthrust and the upthrust? and what is the recommended operating range of the pump? In this article, pump performance curve is further detailed and we will answer the following two questions :
- How the shape of the pump performance curve is related to changes in well performance?
- What are the tolerance limits of performance data?
Shape of the pump performance curve:
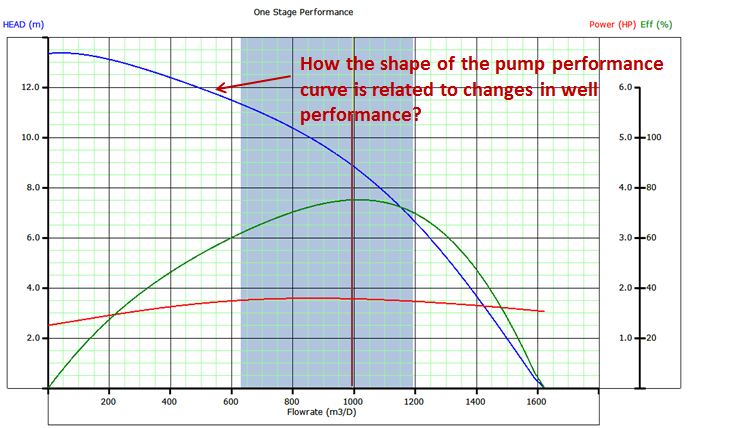
The ability of a pump to adapt to changes in well performance depends on the characteristic shape of the pump performance curve.

A pump with a steep characteristic (i.e. large change in head with respect to flow rate) is less suited to a well with poorly defined inflow performance (IPR), especially if it is intended to produce with a fixed drawdown. For such pumps, a small loss in IPR translates to a large fall in pump intake pressure and may result in gas locking.
Conversely, the head produced by a pump with a flatter characteristic will change less for a given change of flow rate and can therefore be used over a wider variety of IPR’s with limited changes in intake pressure.
Pump performance data tolerance limits:
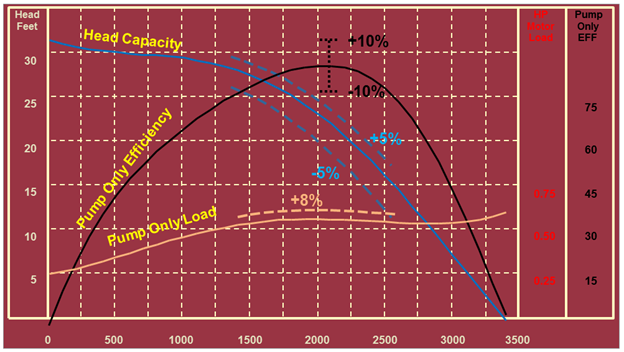
Mainly due to manufacturing tolerances, a variance in performance as compared to published curves can exist from one pump to another of the same design. The accepted tolerances between published curves and actually tested pump performance are depicted in the table below, as specified in API RP 11S2 (2nd Edition, 1997).
| Parameter | Tolerance | Applied to |
| Head | ±5% | Recommended range |
| Flow rate | ±5% | Recommended range |
| Brake horsepower | ±8% | Recommended range |
| Efficiency | -10% | Best efficiency point (BEP) |
Capacity – barrels per day


