ESP design – Step 2: Production Capacity

Once the first step “Collect basic data” is performed, we pass to the ” step 2: Production Capacity “ of the ESP Nine Step Design Procedure. It consists on predicting the well inflow performance which represents the relationship between pressure and flow rate at the well face of an individual well and it is physically defined as the well flowing bottom-hole pressure (Pwf) as a function of production rate. It describes the flow in the reservoir.

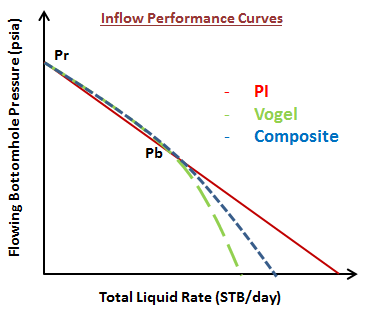
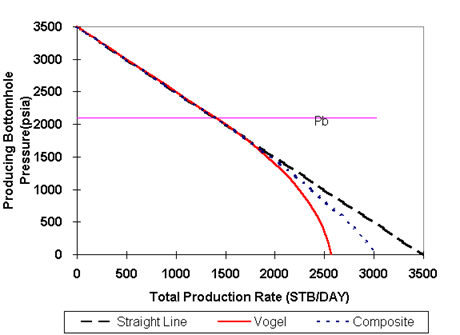
Many inflow performance relationships (IPR’s) are described in the literature. In this article, we will briefly present three of the most widely used IPR’s to describe the well performance:


Continue reading

The Composite Inflow Performance Relationship

The Composite Inflow Performance Relationship is based on the combination of PI model, presented in the previous articles “Well Inflow Performance”, and “Vogel’s inflow performance relationship”. As per the aforementioned articles, PI model could be used if the well producing a single phase flow with no gas in the solution (Pwf > Pb). In the other hand, Vogel’s IPR could be used when the well’s flowing bottomhole pressure (Pwf) is below the bubble point pressure (Pb) and if the produced fluid is pure oil.

If the Pwf is below Pb and well’s produced fluids is a mixture of oil, water, and gas, the inflow performance could be described by the Composite IPR. In this case, IPR curves are somewhere between the curves valid for pure oil (Vogel model) and the one valid for Pwf > Pb (PI model).

The following graph shows the differences between these methods in graphical form:

You May Also Like…