Pressure Gradient

Pressure and depth:

“Pressure and Depth” is the FUNDAMENTAL relationship in the oil industry. Your understanding of the concept is crucial. The easiest way to calculate pressure from depth is to use the pressure gradient of the given fluid.

Pressure gradients for incompressible fluids have units of pressure/depth. For example, psi/ft, bar/m.

Pressure gradient seems difficult, but it is simply using the density of the fluid and converting units:

The density of pure water is 1000 kg/m3. To convert to gradient:

  • 1 kg = 2.2 pounds
  • 1 m = 39.37 inches
  • 1 m = 3.28 feet

0.433 is the gradient for pure water (SG = 1) in Imperial units, remember it.

NB: Specific Gravity is always relative to pure water.

Continue reading

ESP design – Step 2: Production Capacity

Once the first step “Collect basic data” is performed, we pass to the ” step 2: Production Capacity “ of the ESP Nine Step Design Procedure. It consists on predicting the well inflow performance which represents the relationship between pressure and flow rate at the well face of an individual well and it is physically defined as the well flowing bottom-hole pressure (Pwf) as a function of production rate. It describes the flow in the reservoir.

Many inflow performance relationships (IPR’s) are described in the literature. In this article, we will briefly present three of the most widely used IPR’s to describe the well performance:


Continue reading

The Composite Inflow Performance Relationship

The Composite Inflow Performance Relationship is based on the combination of PI model, presented in the previous articles “Well Inflow Performance”, and “Vogel’s inflow performance relationship”. As per the aforementioned articles, PI model could be used if the well producing a single phase flow with no gas in the solution (Pwf > Pb). In the other hand, Vogel’s IPR could be used when the well’s flowing bottomhole pressure (Pwf) is below the bubble point pressure (Pb) and if the produced fluid is pure oil.

If the Pwf is below Pb and well’s produced fluids is a mixture of oil, water, and gas, the inflow performance could be described by the Composite IPR. In this case, IPR curves are somewhere between the curves valid for pure oil (Vogel model) and the one valid for Pwf > Pb (PI model).

The following graph shows the differences between these methods in graphical form:

You May Also Like…


Vogel’s inflow performance relationship

In 1968, Vogel established an empirical relationship ( Vogel’s inflow performance relationship )for flowrate prediction of a solution gas-drive reservoir in terms of the wellbore pressure based on reservoir simulation results.

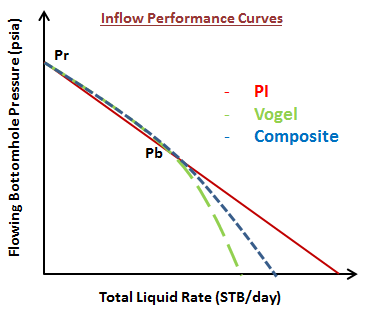
Vogel’s Model compared to PI Model…

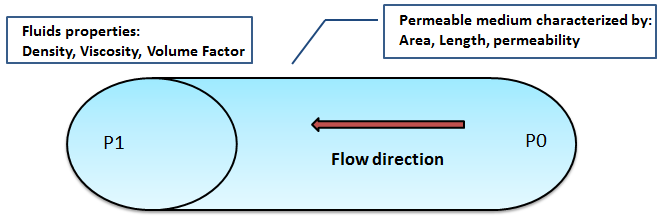
The PI model works very well for single phase fluid (water, oil, or water/oil) flowing into a wellbore, even though water and oil are two separate phases, they are considered as a single phase since they are both liquid.

But what happens when gas comes out of solution?

” The flow velocity of a fluid in a porous medium is inversely proportional to the fluid viscosity. Typically, gas viscosity in the reservoir is about fifty times smaller than for liquid oil and consequently, the gas flow velocity is much greater. As a result, it is normal, when producing from a reservoir in which there is a free gas saturation, that gas will be produced in disproportionate amounts in comparison to the oil “. (Dake, fundamentals of reservoir engineering).

Compared to liquid, gas has much higher permeability and much lower viscosity. These two factors will give the gas a much higher flow rate than liquid inside the reservoir, so that:

QG >> QL

Below the bubble point pressure, the solution gas escapes from the oil and become free gas. The free gas occupies some portion of pore space and reduces flow of oil. This effect is quantified by:

  • A decrease of oil Relative permeability
  • An increase of oil viscosity (as its solution gas content drops)

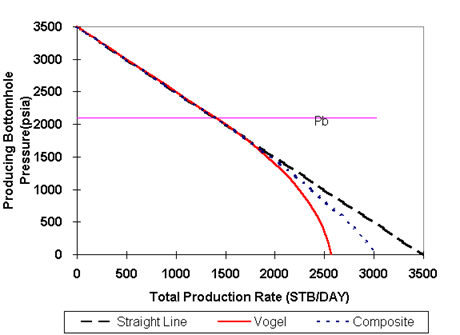
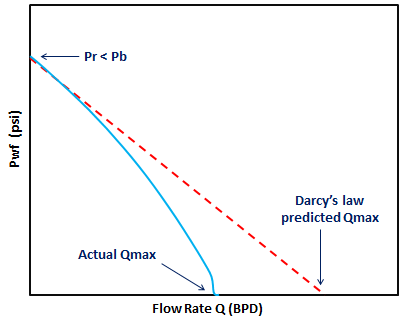
Therefore, the combination of the relative permeability effect and the viscosity effect results in lower oil production rate at a given bottom-hole pressure.

Graphically, it would looks like this:

Continue reading

Well Inflow Performance

Well Inflow Performance represents the relationship between pressure and flow rate at the well face of an individual well. The scientist Darcy was the first studied extensively the relationship between pressure and flow rate. His experimental studies consist on creating a pressure differential across a porous media and measured the resulting flow rate.

Darcy’s experiments result in what is known as “Darcy’s law”. For general flow through a porous media:

Continue reading