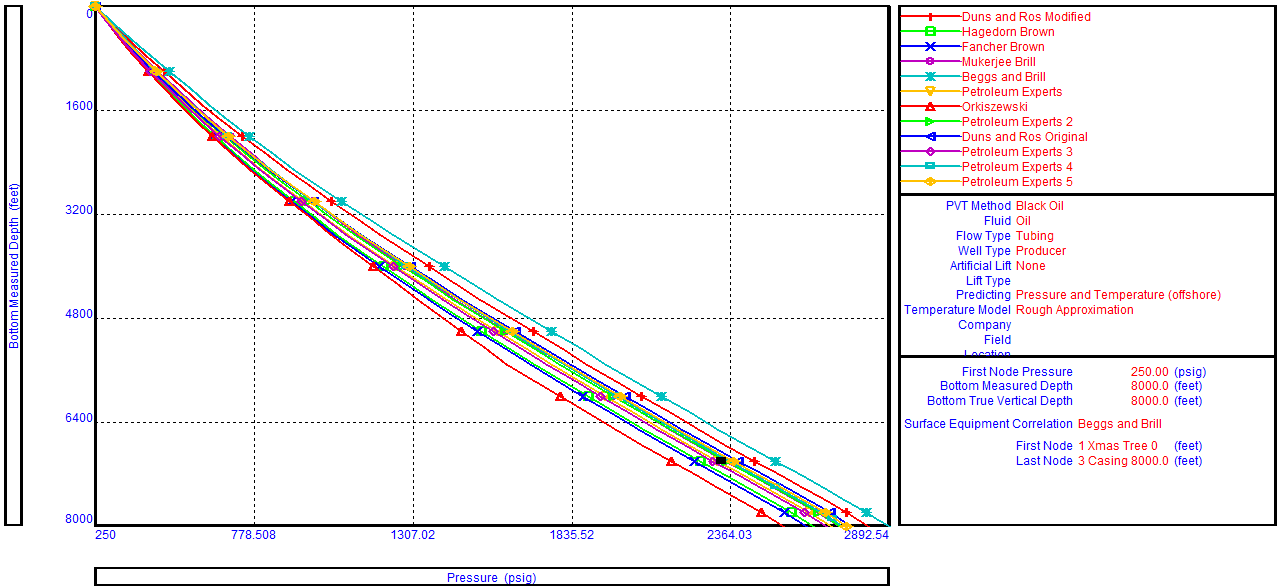
There is no universal rule for selecting the best flow correlation for a given application. When an outflow performance simulator is used, it is recommended that a Correlation Comparison always be carried out. By inspecting the predicted flow regimes and pressure results, the User can select the correlation that best models the physical situation. Refer to the article titled “Multiphase flow correlations” for more details about flow correlations and their use.
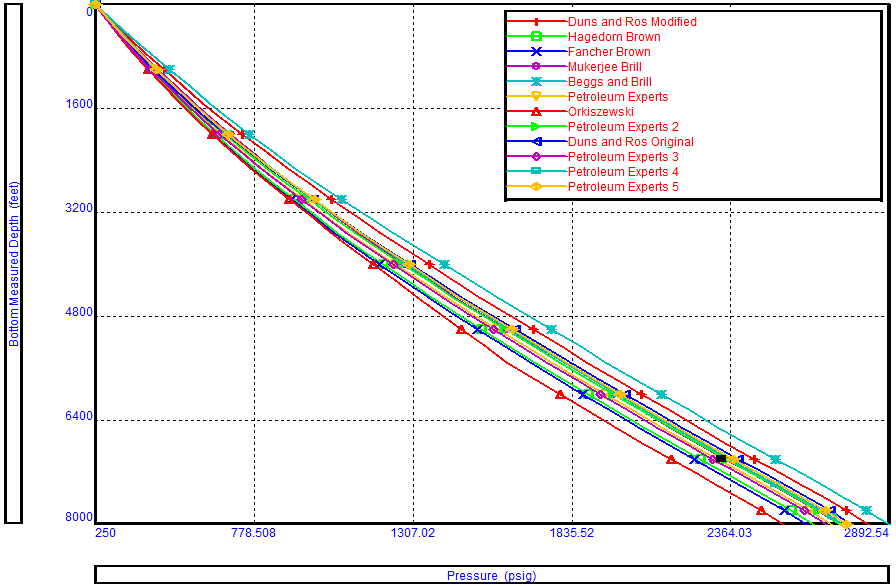
Fancher and Brown is a no-slip correlation, with no flow regime map. Therefore, this correlation cannot be recommended for general use and should not be used for quantitative work. on the other hand, Duns and Ros Modified gives the highest pressure drops in the slug flow regime for oil wells. This is why Fancher Brown (no slip) and Duns and Ros Modified can serve only as quality check boundaries for downhole measurements.