Multiphase flow regimes

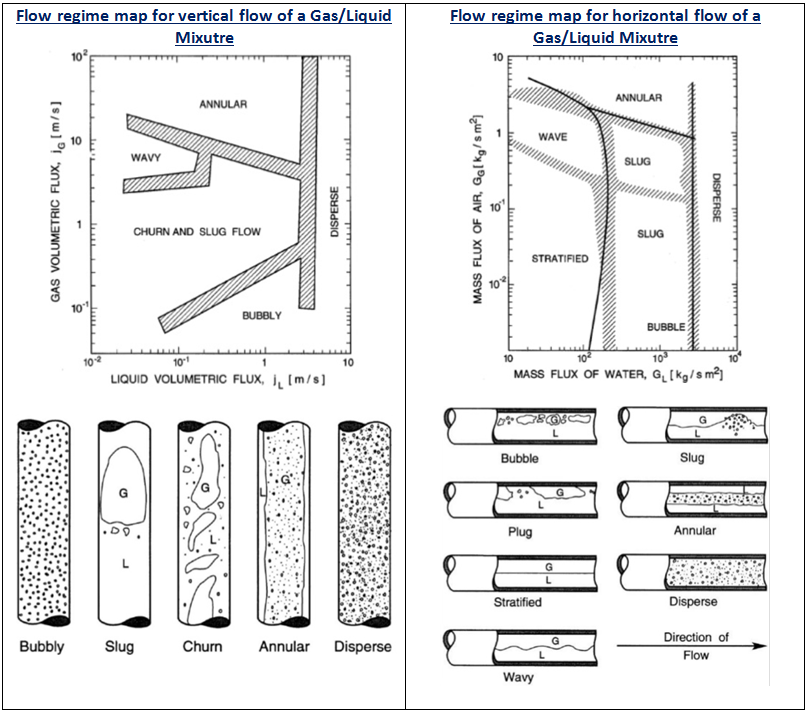
Flow Regime maps are useful tools for getting an overview over which flow regimes we can expect for a particular set of input data. Each map is not, however, general enough to be valid for other data sets. It gives a description of the geometrical distribution of a multiphase fluid moving through a pipe. Different flow regimes are used to describe this distribution, the distinction between each one being qualitative and somewhat arbitrary. In vertical or moderately deviated pipes, the most common flow regimes for gas-liquid mixtures are bubble flowslug flowmist flow, churn flow and annular flow. In horizontal wells, there may be stratified or wavy stratified flow in addition to many of the regimes observed in vertical wells. Two-phase flow regimes have often been presented as plots, or maps, with the phase velocities or functions of them on each axis. Earlier maps were named after their authors, for example Griffith-Wallis, Duns-Ros and Taitel-Dukler. The following Figures give an example of flow regime map for a vertical and horizontal flow of a Gas/Liquid mixture.

Continue reading

Pressure drawdown & Skin Factor

Pressure Drawdown:

Pressure Drawdown (∆P) is defined as the difference between the static bottom hole pressure (SBHP) and the flowing bottom hole pressure (Pwf). Thus, the drawdown is the differential pressure that drives fluids from the reservoir into the wellbore.

∆P= Pressure drawdown = SBHP – Pwf

Example:

If SBHP = 200 bar, and Pwf  = 80 bar; therefore the Pressure drawdown (∆P) = 200 – 80 = 120 bar.

The amount of pressure drawdown dictates the amount of flow into the wellbore or production. The higher the pressure drawdown is, the higher the production rate. The drawdown, and therefore the production rate of a producing interval is typically controlled by surface chokes.

NB: Reservoir conditions, such as the tendency to produce sand, may limit the drawdown that may be safely applied during production before damage or unwanted sand production occurs.

Continue reading

Pressure Gradient

Pressure and depth:

“Pressure and Depth” is the FUNDAMENTAL relationship in the oil industry. Your understanding of the concept is crucial. The easiest way to calculate pressure from depth is to use the pressure gradient of the given fluid.

Pressure gradients for incompressible fluids have units of pressure/depth. For example, psi/ft, bar/m.

Pressure gradient seems difficult, but it is simply using the density of the fluid and converting units:

The density of pure water is 1000 kg/m3. To convert to gradient:

  • 1 kg = 2.2 pounds
  • 1 m = 39.37 inches
  • 1 m = 3.28 feet

0.433 is the gradient for pure water (SG = 1) in Imperial units, remember it.

NB: Specific Gravity is always relative to pure water.

Continue reading

The Composite Inflow Performance Relationship

The Composite Inflow Performance Relationship is based on the combination of PI model, presented in the previous articles “Well Inflow Performance”, and “Vogel’s inflow performance relationship”. As per the aforementioned articles, PI model could be used if the well producing a single phase flow with no gas in the solution (Pwf > Pb). In the other hand, Vogel’s IPR could be used when the well’s flowing bottomhole pressure (Pwf) is below the bubble point pressure (Pb) and if the produced fluid is pure oil.

If the Pwf is below Pb and well’s produced fluids is a mixture of oil, water, and gas, the inflow performance could be described by the Composite IPR. In this case, IPR curves are somewhere between the curves valid for pure oil (Vogel model) and the one valid for Pwf > Pb (PI model).

The following graph shows the differences between these methods in graphical form:

You May Also Like…


Vogel’s inflow performance relationship

In 1968, Vogel established an empirical relationship ( Vogel’s inflow performance relationship )for flowrate prediction of a solution gas-drive reservoir in terms of the wellbore pressure based on reservoir simulation results.

Vogel’s Model compared to PI Model…

The PI model works very well for single phase fluid (water, oil, or water/oil) flowing into a wellbore, even though water and oil are two separate phases, they are considered as a single phase since they are both liquid.

But what happens when gas comes out of solution?

” The flow velocity of a fluid in a porous medium is inversely proportional to the fluid viscosity. Typically, gas viscosity in the reservoir is about fifty times smaller than for liquid oil and consequently, the gas flow velocity is much greater. As a result, it is normal, when producing from a reservoir in which there is a free gas saturation, that gas will be produced in disproportionate amounts in comparison to the oil “. (Dake, fundamentals of reservoir engineering).

Compared to liquid, gas has much higher permeability and much lower viscosity. These two factors will give the gas a much higher flow rate than liquid inside the reservoir, so that:

QG >> QL

Below the bubble point pressure, the solution gas escapes from the oil and become free gas. The free gas occupies some portion of pore space and reduces flow of oil. This effect is quantified by:

  • A decrease of oil Relative permeability
  • An increase of oil viscosity (as its solution gas content drops)

Therefore, the combination of the relative permeability effect and the viscosity effect results in lower oil production rate at a given bottom-hole pressure.

Graphically, it would looks like this:

Continue reading